
mapping an island’s metabolism.
Every project we take on sits on the same island. So we built a map of what flows into Malta, through it and out again: electricity, water, food, building material, waste, traffic and people. Published figures exactly as published, and our own models marked as models.
Every project we take on sits on the same island. At the start of a brief we want the numbers about the place: where the water comes from, where the heat sits, which roads fill up, what the planning zones allow. Those numbers exist, but they live in annual reports, national datasets and planning maps, each with its own year and its own units.
So in 2026 we built the map we wanted to read. Malta Metabolism has been live at malta.mattermake.com since 12 October.
why an island.
An island is a rare thing: a place where the inputs and outputs of a whole economy can actually be counted. Nothing arrives in Malta or leaves it except by ship, by cable or by plane.
That makes it a good place to ask an awkward question: is Malta over its capacity? Where an operator or a regulator has published a ceiling, the map tests the latest load against it. Where nobody has, it says so rather than guess.
The environment is not the backdrop. It is the brief.
For us that line is practical. On an island, a lot of the brief is what comes in by sea and cable, and what has to leave again.
what’s in it.
The island map carries about 120 layers from the national datasets: infrastructure, protected land, surface heat, flood, noise, planning, drainage, ecology and modelled traffic. In and out counts what crosses the shoreline. Flows draws five budgets as diagrams (electricity, water, materials and waste, transport, food) by year or per resident. Capacity sets loads against published ceilings. Site view takes you to any street, with a report you can print. And Ask is an analyst that answers only from the same data, and says “not in the data” when a figure is missing.
measured, or modelled.
We set one rule at the start: never recompute, correct, round differently or invent a figure. A published number is shown exactly as published, with its unit, its year and its source. Where we had to build our own model, it says modelled, so a model is never mistaken for a measurement. Every layer carries a tag (measured, official, modelled or estimate) and a note on where it came from.
We got this wrong once, in words. For a while the header said “every value sourced”. It wasn’t quite true: some layers are our own models, and a few figures are estimates. In October we changed it to “published data and our own models, each labelled with its source and status”. Less of a slogan, and more accurate.
one flow, followed through.
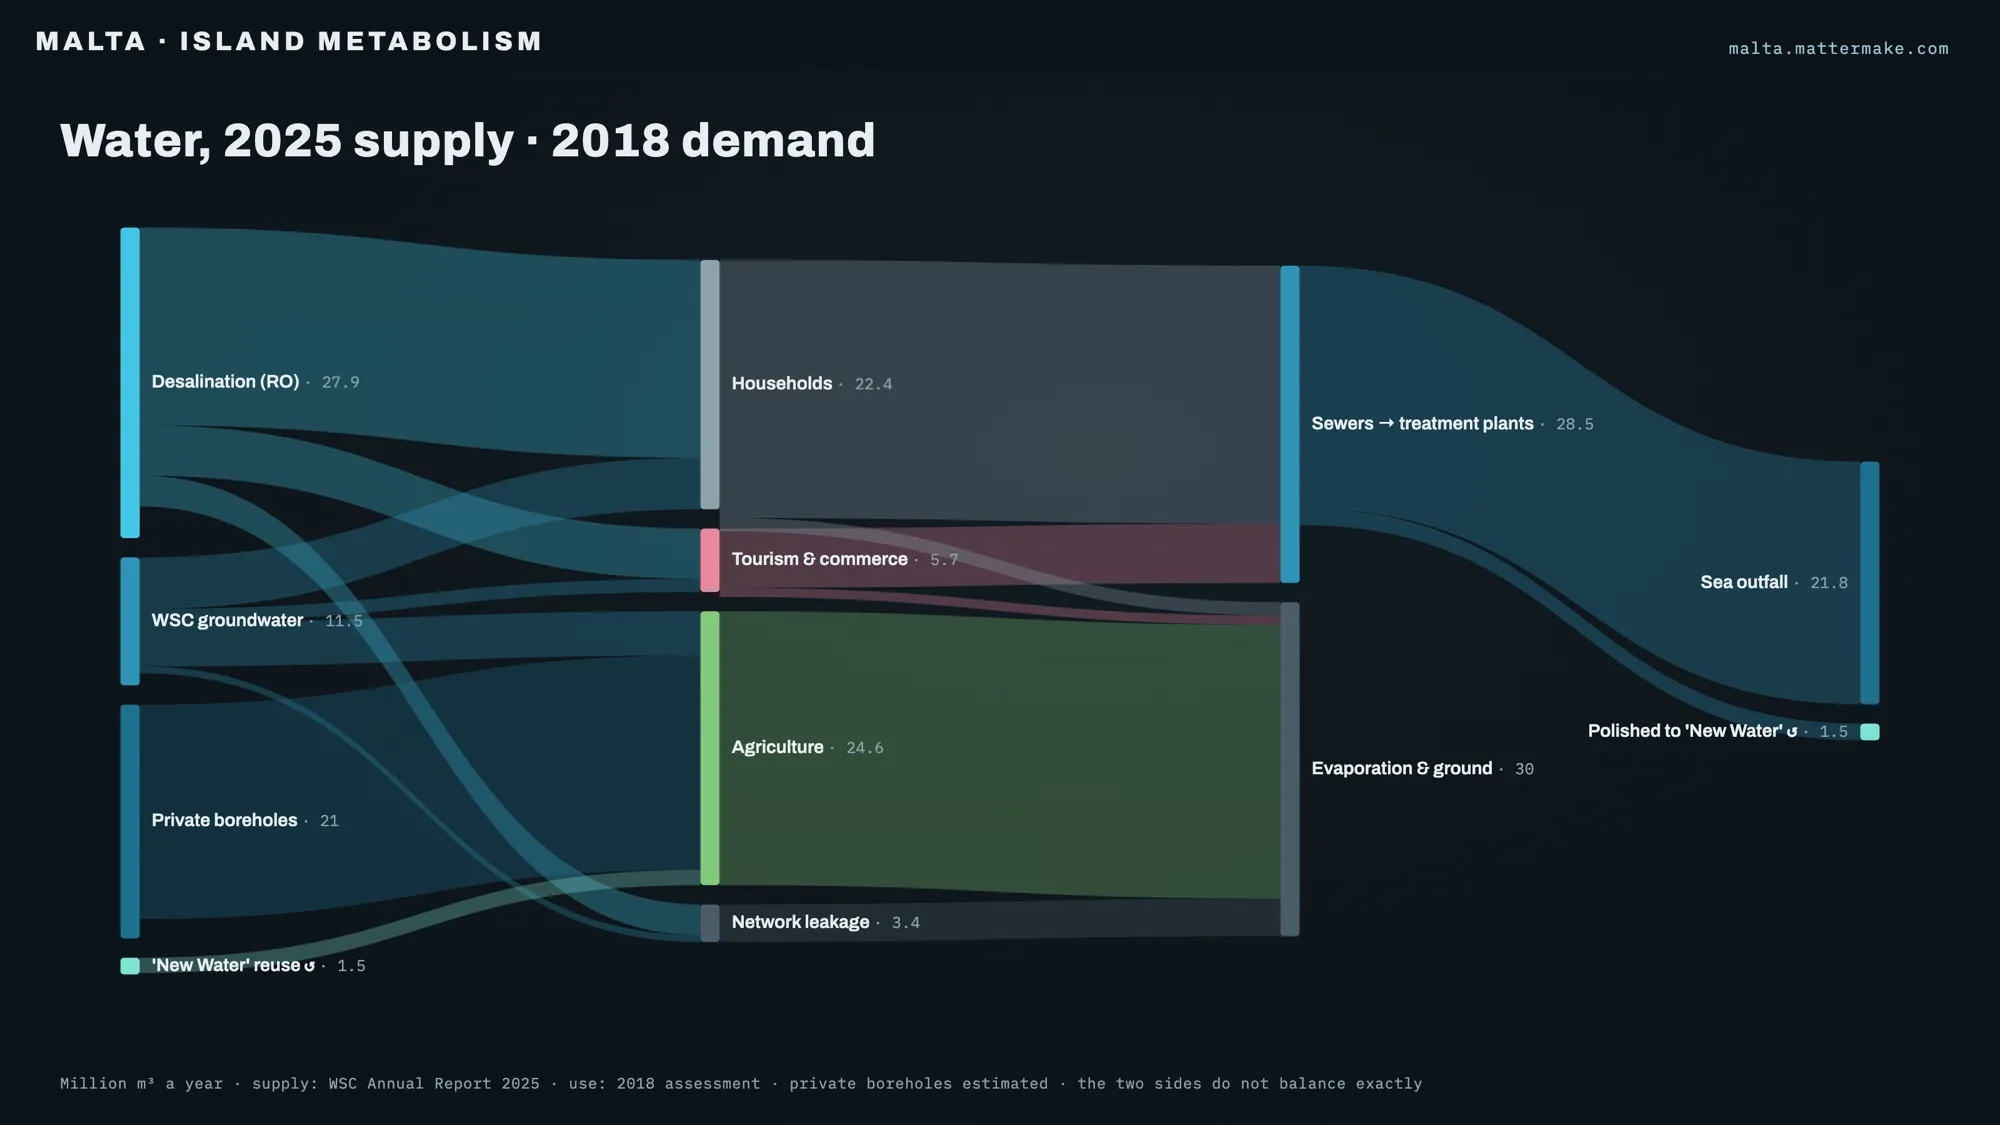
Take water. In 2025, desalination made 27.9 million m³ of drinking water, about 70% of what the Water Services Corporation produced, and its boreholes added 11.5 million. Private boreholes draw roughly another 21 million; that one is an estimate, and the diagram says so.
Then follow it out. In 2024, about 1.5 million m³ of treated sewage came back as New Water, while around 21.8 million went out to sea. One treatment plant, Malta North, took in about twice its design load in 2025.
Electricity reads the same way. The 2025 peak was 636.6 MW, against 828 MW of firm supply: about 77%. A number like that doesn’t tell you what to design. It tells you what you’re designing into.
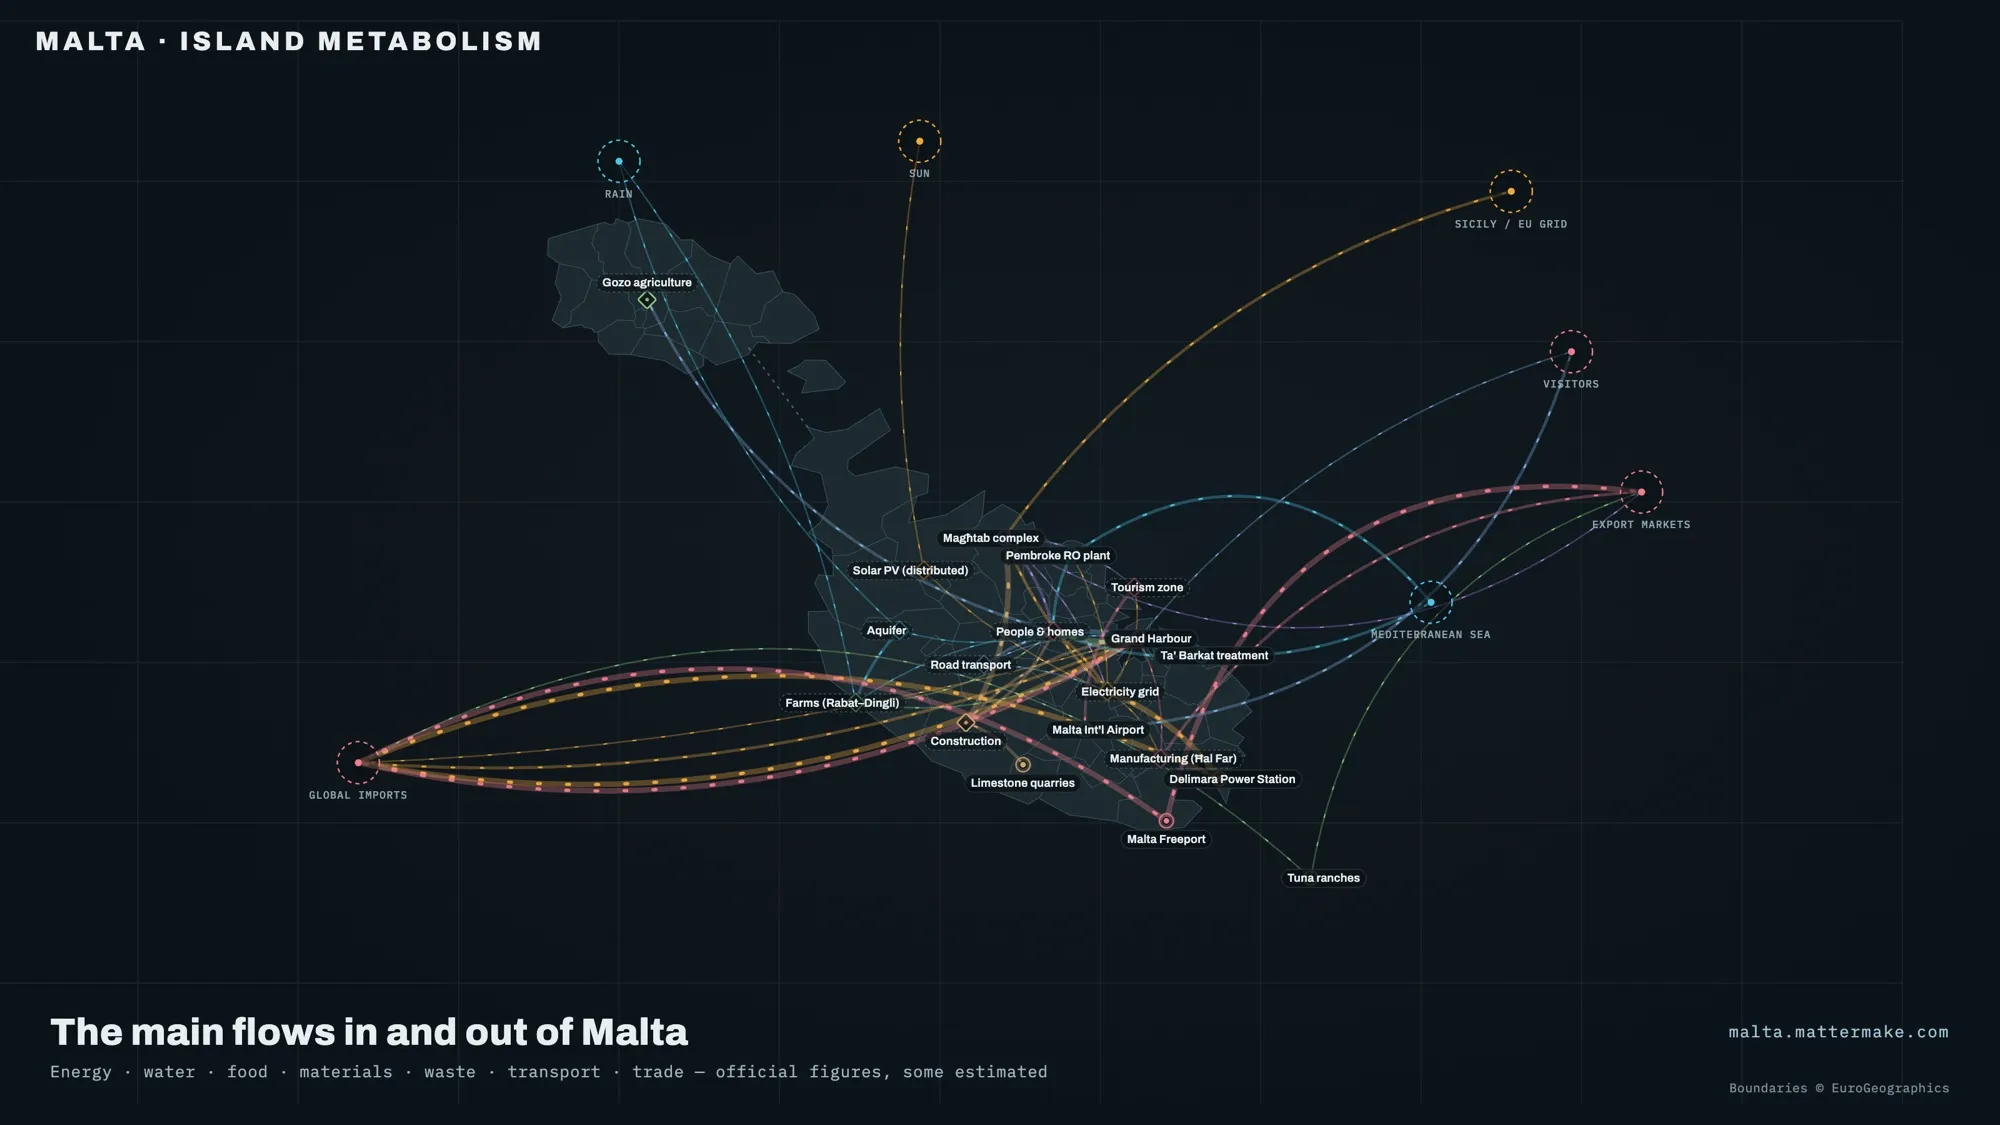 The island’s flows on one map: what comes in at the edge, and where it goes.
pick a shock.
There is also a tab for stress-testing the island. Pick a shock (the Sicily cables tripping, the sea lanes closing, a rainless year meeting a record summer, the Freeport shutting, the landfill filling up) and drag time forward, from a day to three months. What breaks, and when, depends on the buffers: storage, stocks, spare capacity.
We are careful with it. The scenarios are stories built on the data, not forecasts, and the numbers inside them haven’t yet been checked the way the rest of the map has. The modelled runs on the flow diagrams carry the same warning on their badges: indicative, not a forecast.
where it stands.
It’s free. You sign in with your email, with no password, and new accounts see the public level; the rest opens level by level. The terms of use and the privacy notice come before we ask a lot of people to sign up.
We don’t claim to see everything, and we don’t claim to predict anything. It is a way of starting a brief with the island in front of us instead of behind us.