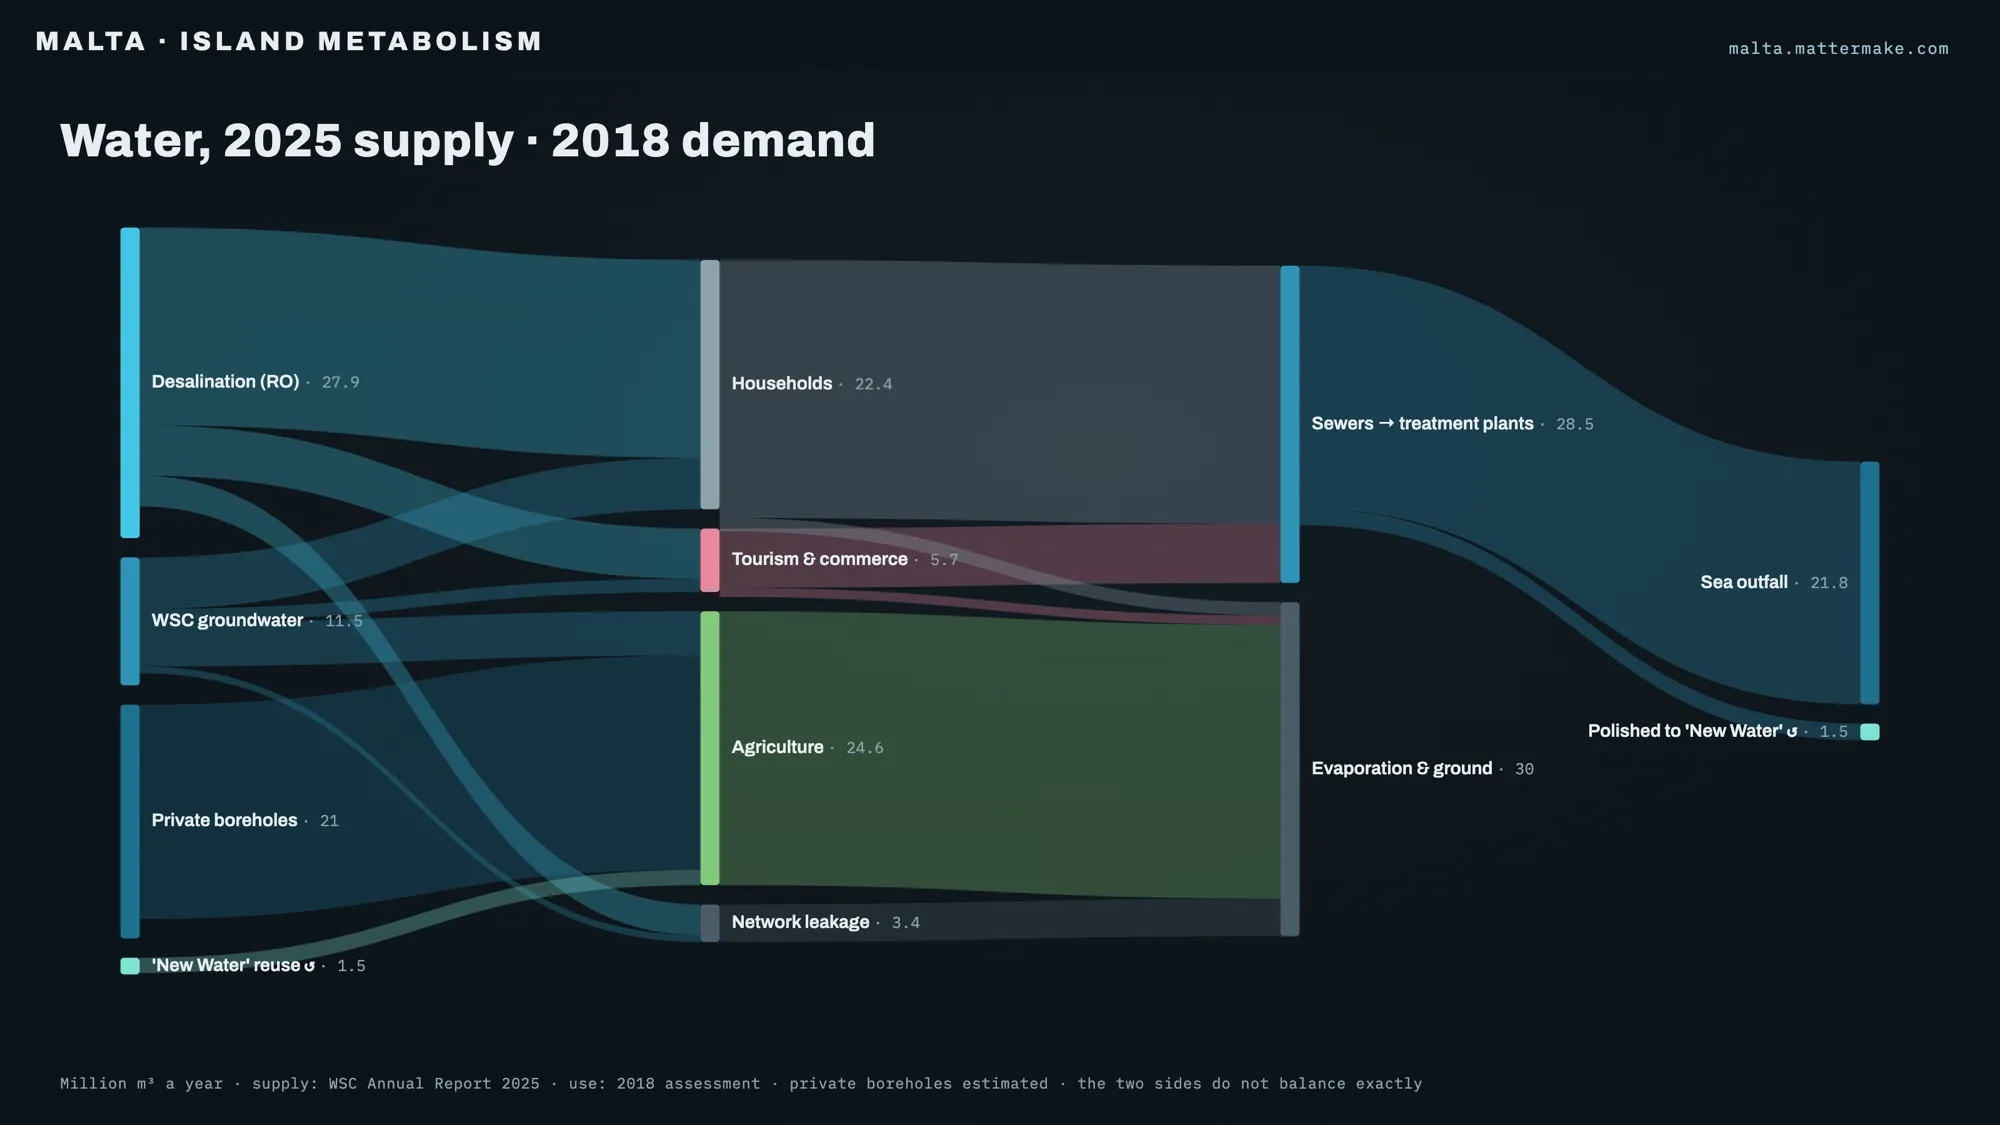
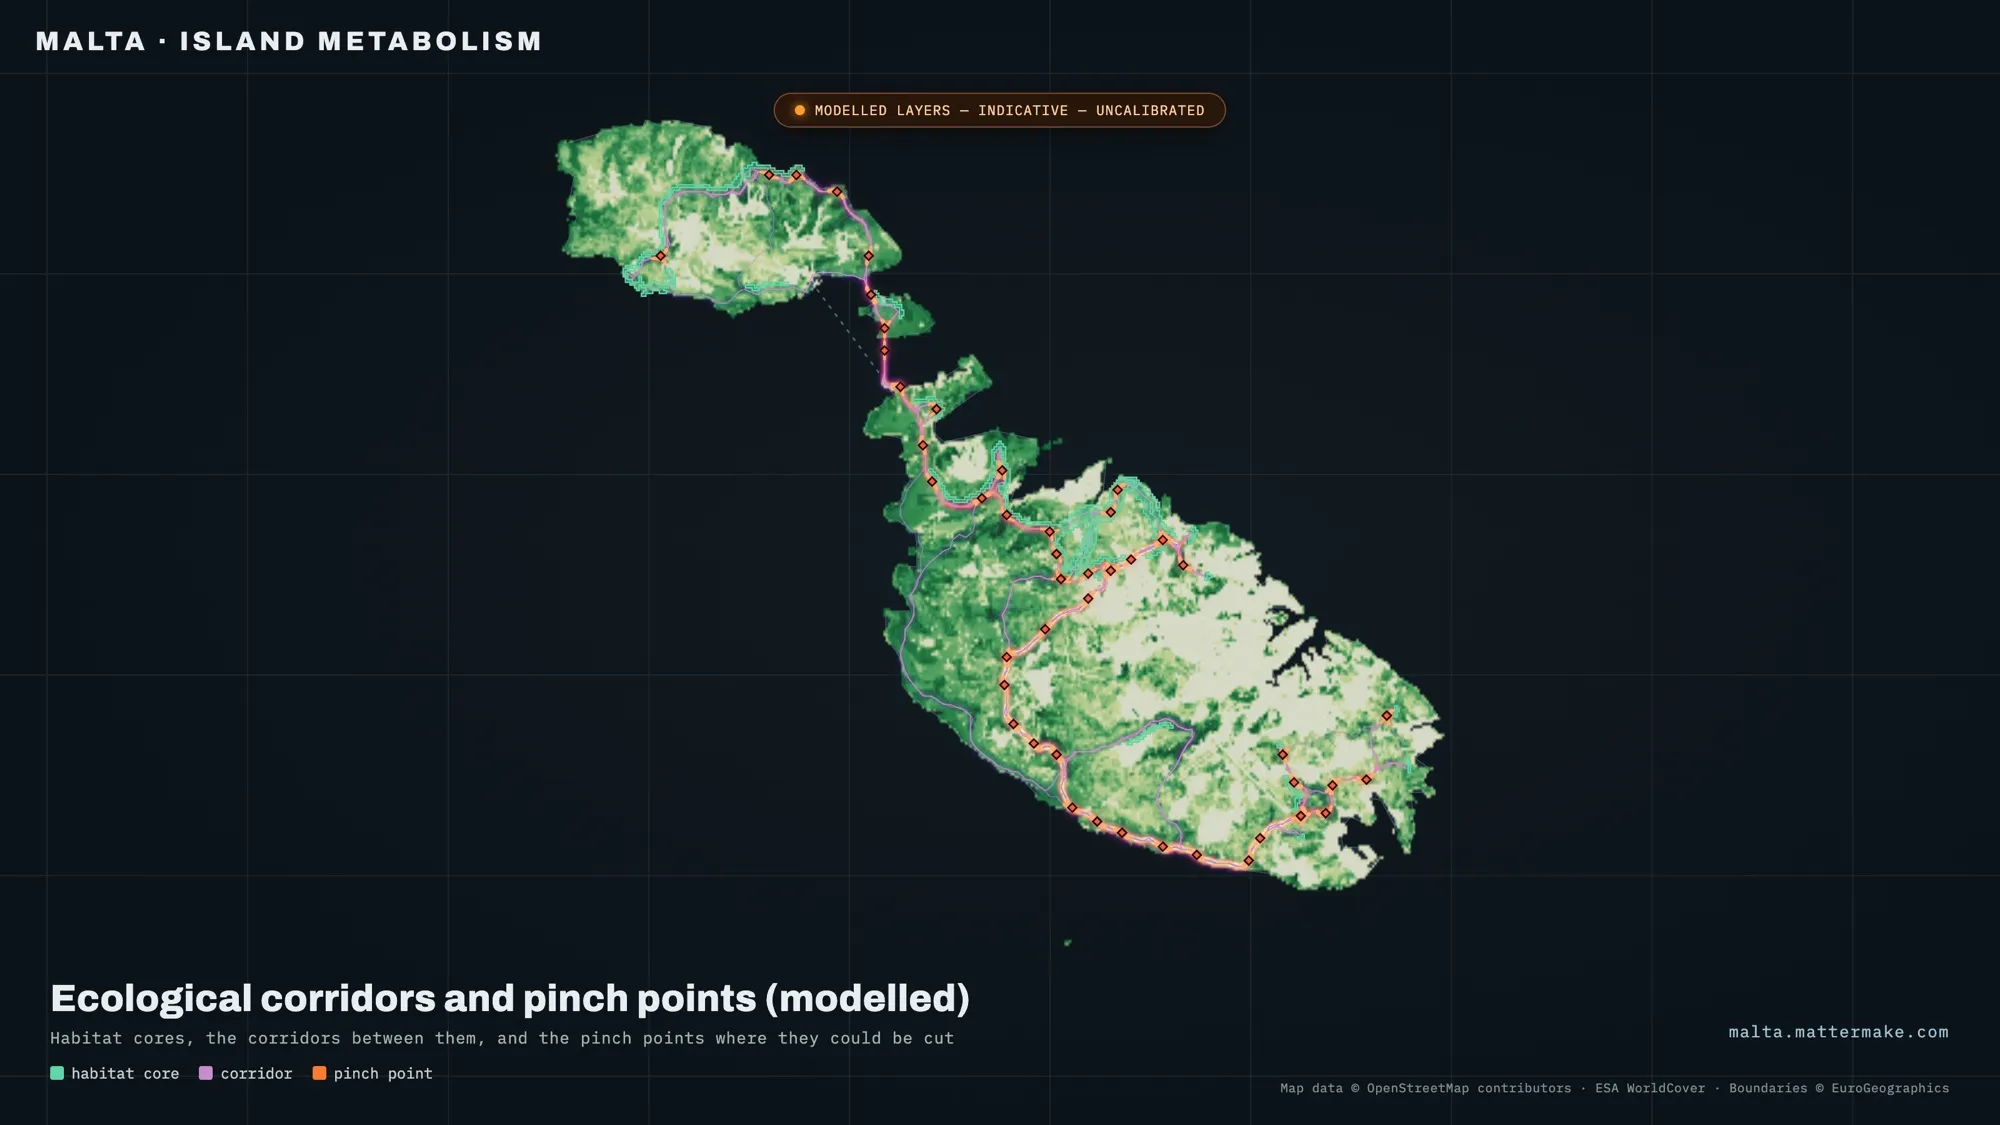
What flows into Malta, through it and out again — energy, water, food, materials, waste, traffic and people. Published data, sourced, every model marked.
what it is.
Malta Metabolism follows what flows into the island, through it and out again: electricity, water, food, building material, waste, traffic and people. It uses published data, shown exactly as published, with its unit, year and source. Where we’ve had to build our own model, it says modelled, so a model is never mistaken for a measurement.
It also shows where the island has room and where it’s stretched. Where an operator or regulator has published a limit, it puts the latest figure next to it. Where nobody has, it says so rather than guess. The environment is the brief, and on an island a lot of that brief is what comes in by sea and cable, and what has to leave again.
where we use it.
At the start of a brief, for the numbers about the place: where the water comes from, where the heat sits, which roads fill up, what the planning zones allow. It’s the same island every project of ours sits on.
what it doesn’t do.
- It doesn’t invent a ceiling. Where no limit is published, the load isn’t tested, and where we had to build one, it says so.
- The models are rough guides. Traffic is a synthetic model, not counted traffic. The ecological corridors are indicative and uncalibrated. Drainage comes from a 30 m terrain model, not a survey.
- The years don’t all match. Figures run from 2018 to 2025, and each one shows its year and status.
- Heat is surface heat: ground and roofs from Landsat in the late morning, not air temperature.
- The map can be behind. The newest buildings may be missing.
- Ask can be wrong. It answers only from the data, and the page says so.
- Not everything is open. What you see depends on your account’s level.
what’s next.
- Clearer wording on the capacity page.
- The terms of use and the privacy notice, published before we ask many people to sign up.
- More of the site opening, level by level.
malta metabolism, up close.